

The Ammonia Map Debate, Why Not All Farming Systems Are Equal
Scale and manure handling change the risk profile, so both blanket claims and blanket defensiveness miss the point.

An interactive ammonia map has been doing the rounds this month, published by Sustain and Compassion in World Farming.
If you read the headlines, you would think the story is simple. Factory farms are poisoning the air, and the map proves it.
If you read the farming press, you would think the story is also simple, just in the opposite direction. This is another campaign hit, built on shaky data, designed to denigrate sectors that are already heavily regulated.
The truth is that neither of those versions is good enough.
It is a tale as old as time, and it is the same argument I keep coming back to. We keep talking about farming as if it is one system, when it is not. Conventional and regenerative, industrial and small scale, indoor and outdoor, those differences are not branding. They are the difference between how impacts show up, and where.
This information does not appear out of thin air. But it also does not arrive as pure truth. It is collected, modelled, averaged, mapped, and then turned into claims.
So the question I keep coming back to is not who is shouting loudest. It is who is showing their workings.
The language problem
One reason this debate goes nowhere is that we keep using blanket terms, and then acting surprised when people hear something else.
When experts, campaigners, or headlines say animal agriculture is the problem, most people do not hear a technical point about emissions categories. They hear a moral verdict about meat, full stop. That is how you end up with a story where livestock can become the scapegoat for climate and pollution, and the only “solution” on offer is that everyone should eat less meat, without much detail about which systems are driving the harm.
If we want truth rather than tribalism, we have to talk about systems and scale, not just species. That is where the risk profile changes, and that is where the evidence has to be specific. Industrial livestock systems concentrate animals, concentrate waste, and concentrate the impacts in particular places. That is not the same thing as saying all meat is equally damaging, or that all livestock farming is the same.
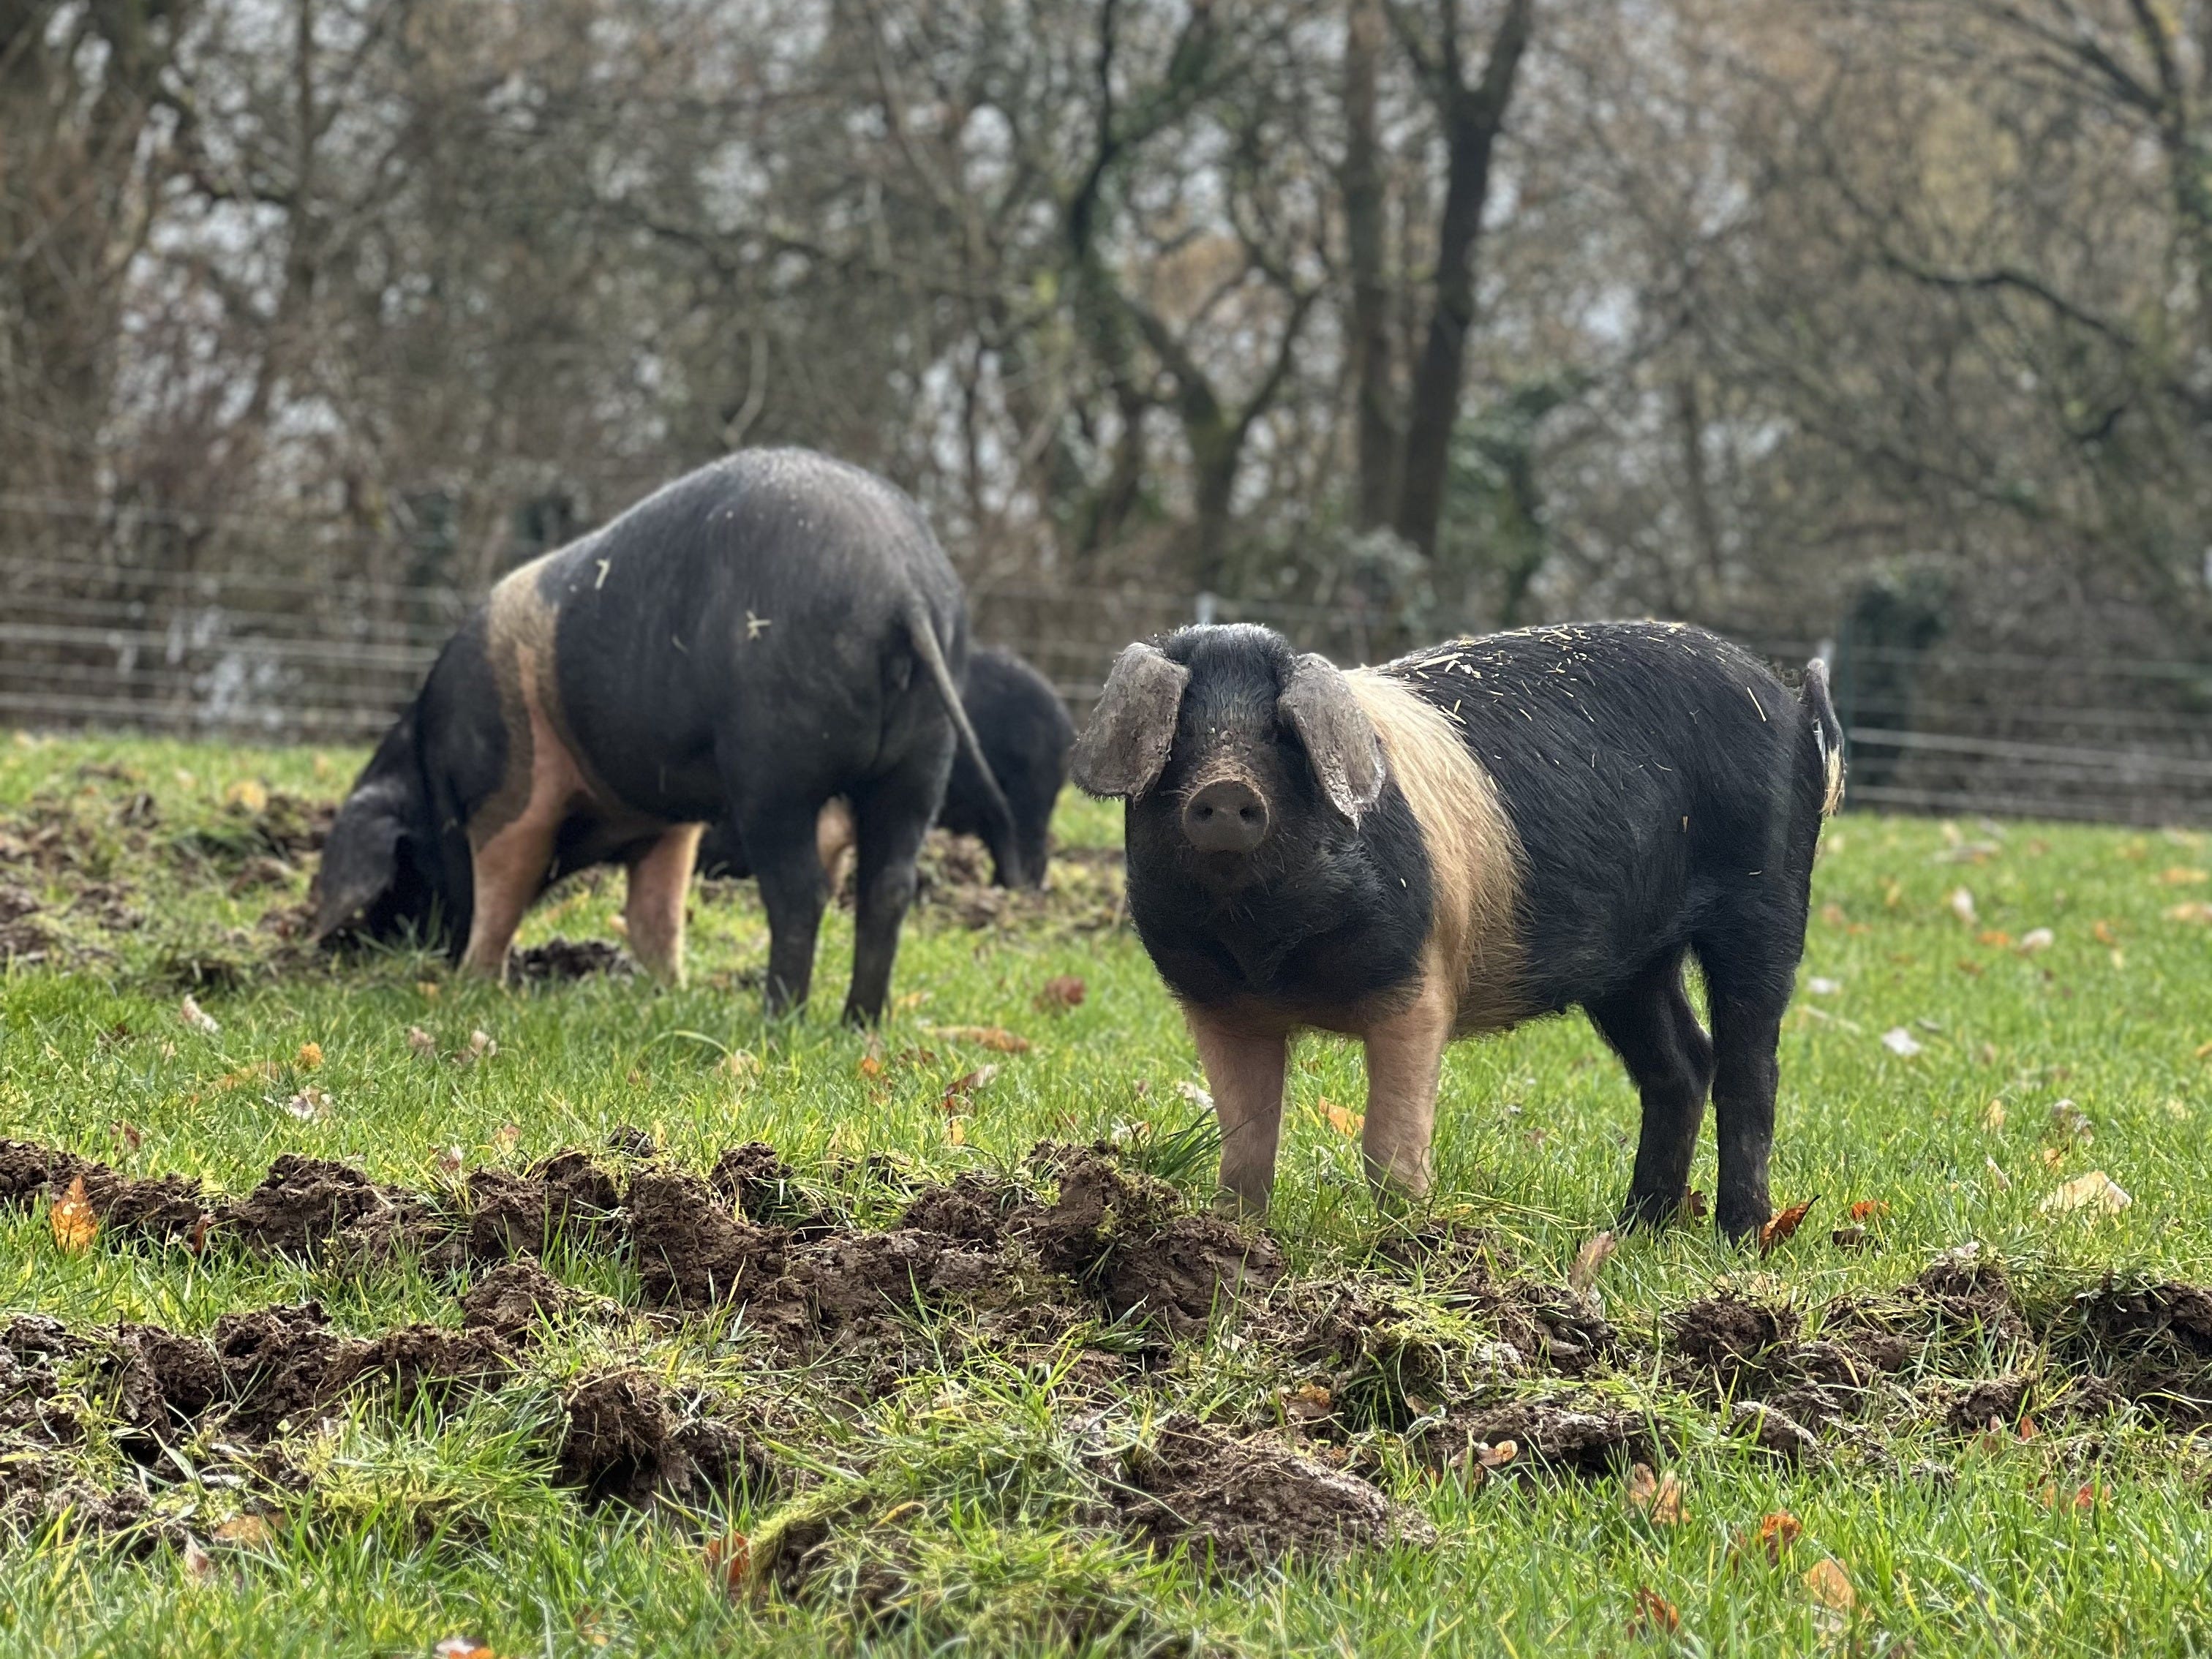
Cows on permanent pasture, pigs in deep straw yards, broilers in high density sheds, and mixed farms cycling manure back onto land are not the same system, and they do not create the same risks. If you are trying to make sense of the ammonia map, that difference is the whole story.
The question is not just, do I eat meat. It is what kind of system did this come from, and what does it concentrate that I never have to see.
A model, not a measurement
Sustain’s map is not a set of air quality readings taken outside your back door.
It is a modelled estimate of ammonia production and emissions from the largest industrial pig and poultry units, mapped by area.
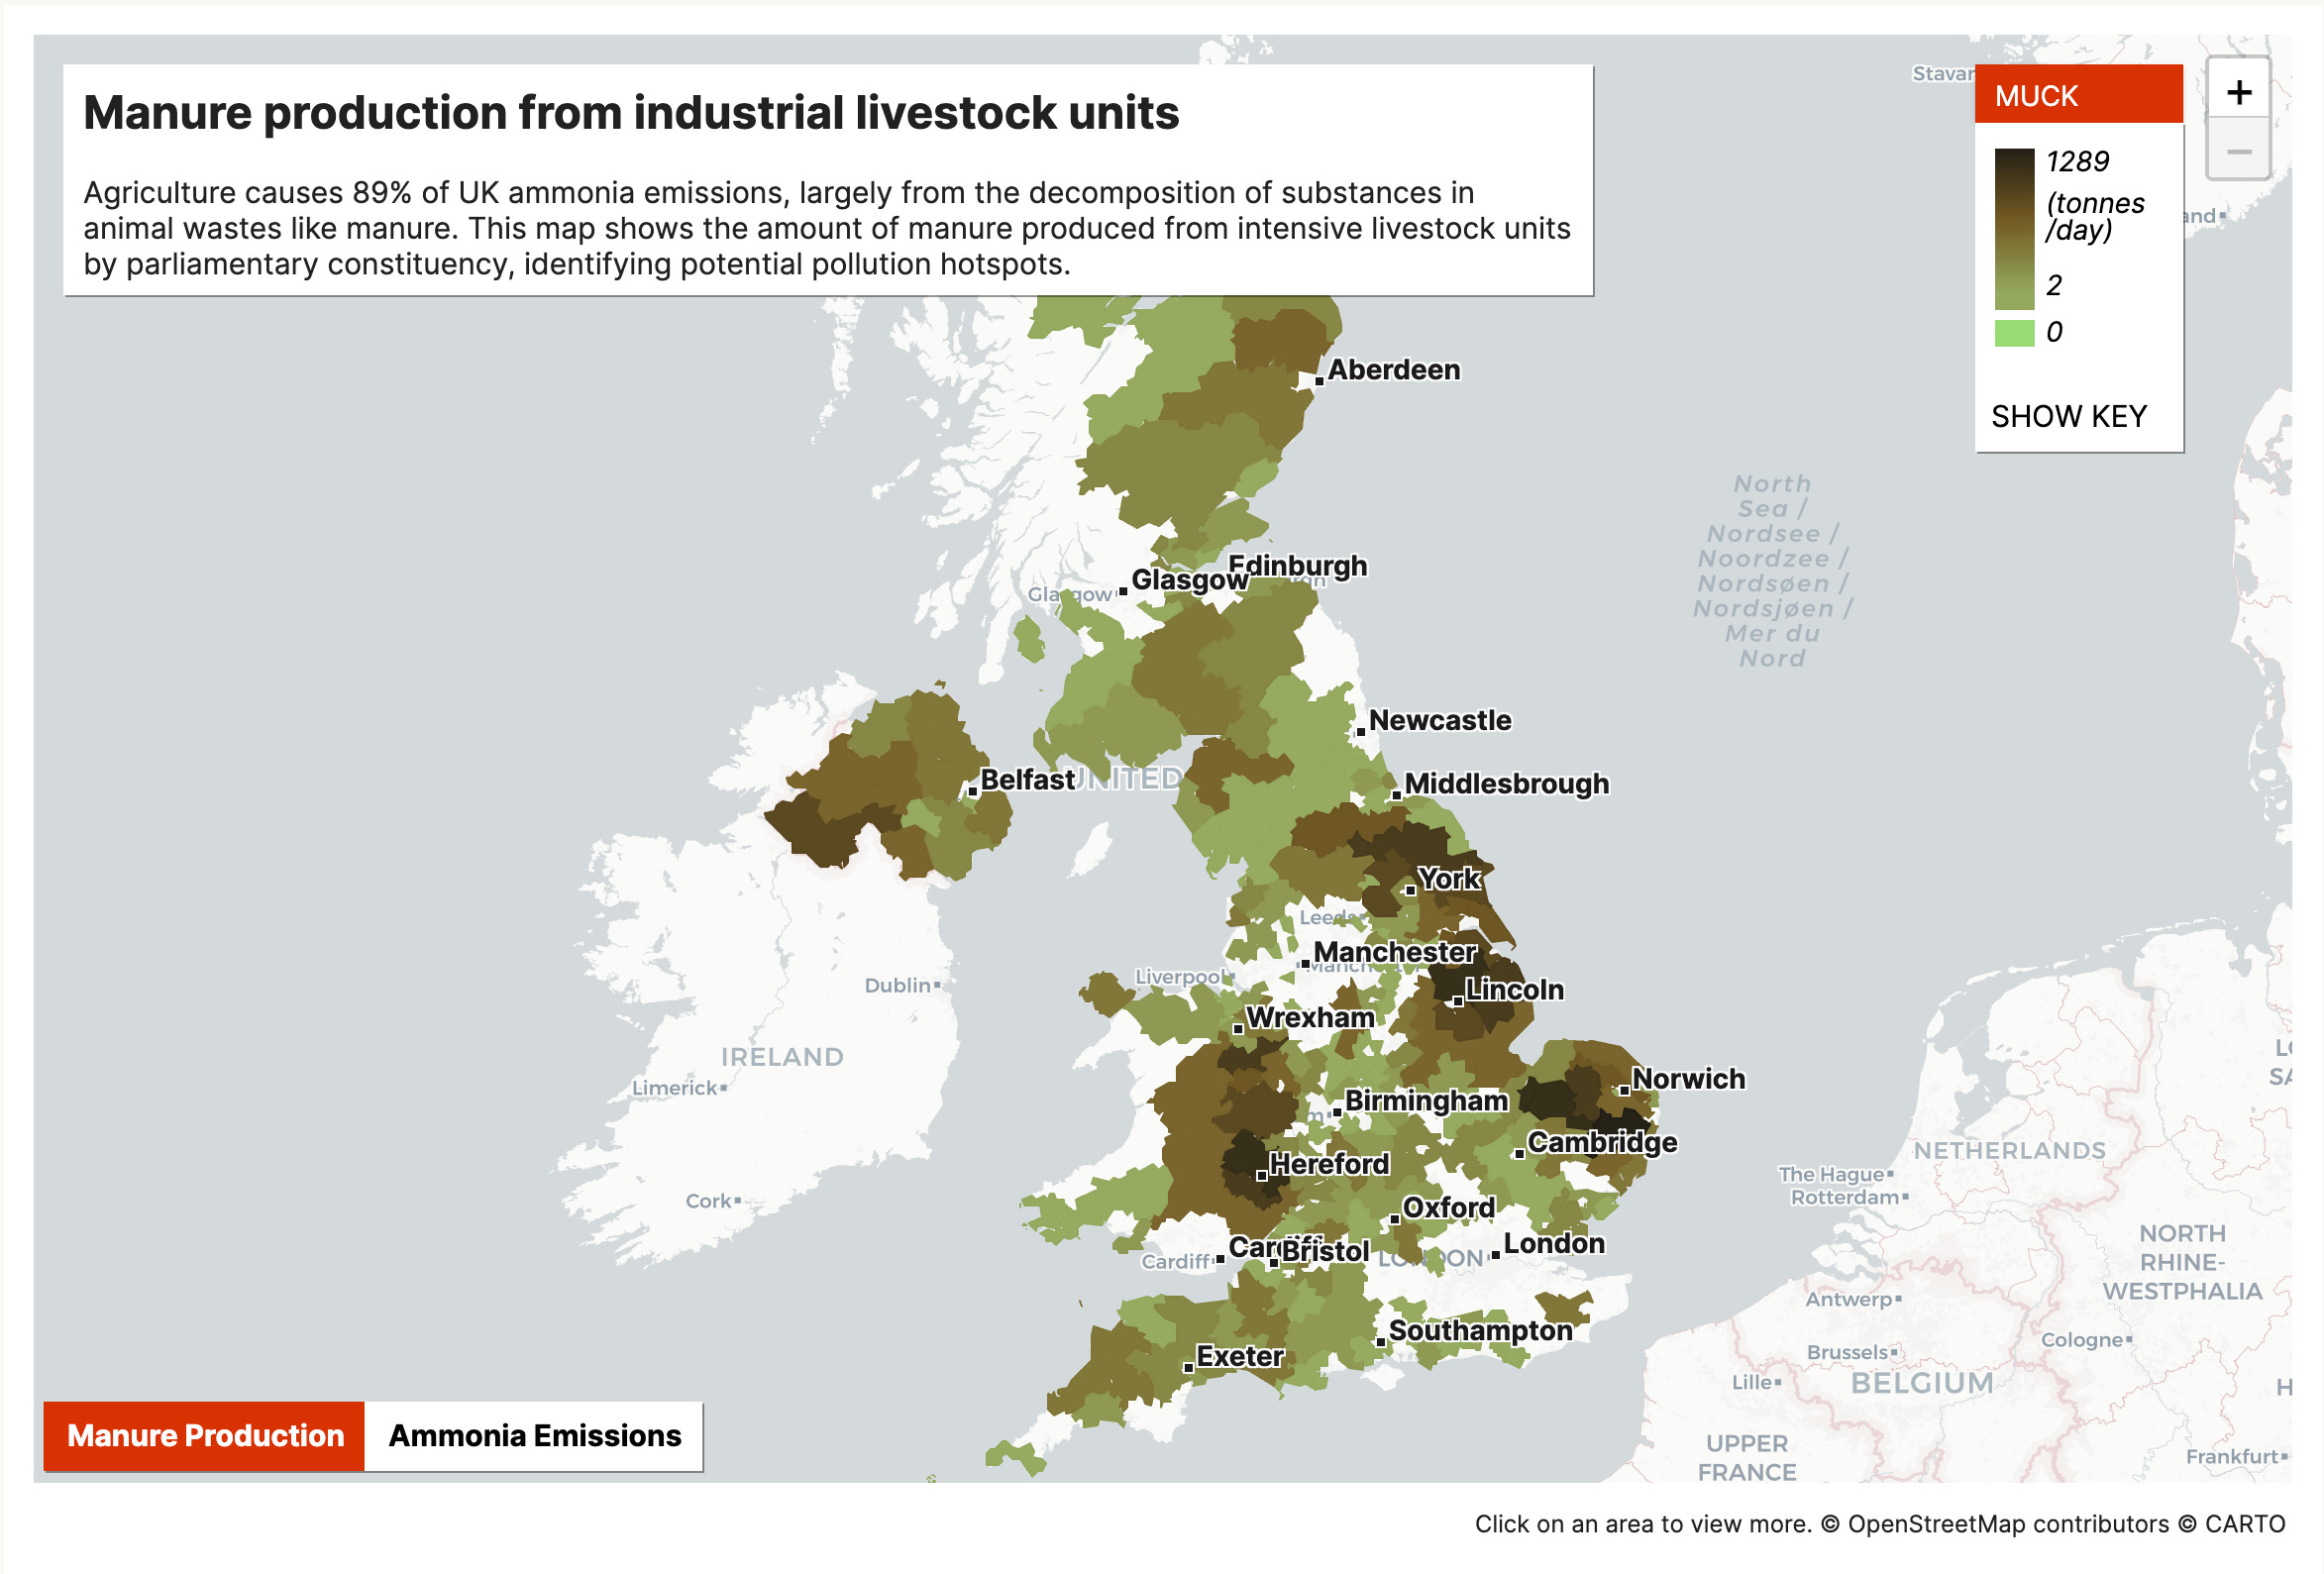
Sustain is also explicit about what the map does and does not cover. It shows only the largest intensive livestock units, it is based on average ammonia production over a life cycle, and it does not capture emission peaks, for example when sheds are cleaned out. Those limitations do not make it useless. They define what it can and cannot prove.
A tool can be directionally helpful and still be blunt at street level. The national picture and the local picture are not the same thing.
I have not worked inside a factory farm. But I do work with Farms Not Factories, so I have a pretty good idea of what happens inside intensive pig and poultry systems, and what the pressure points tend to be.
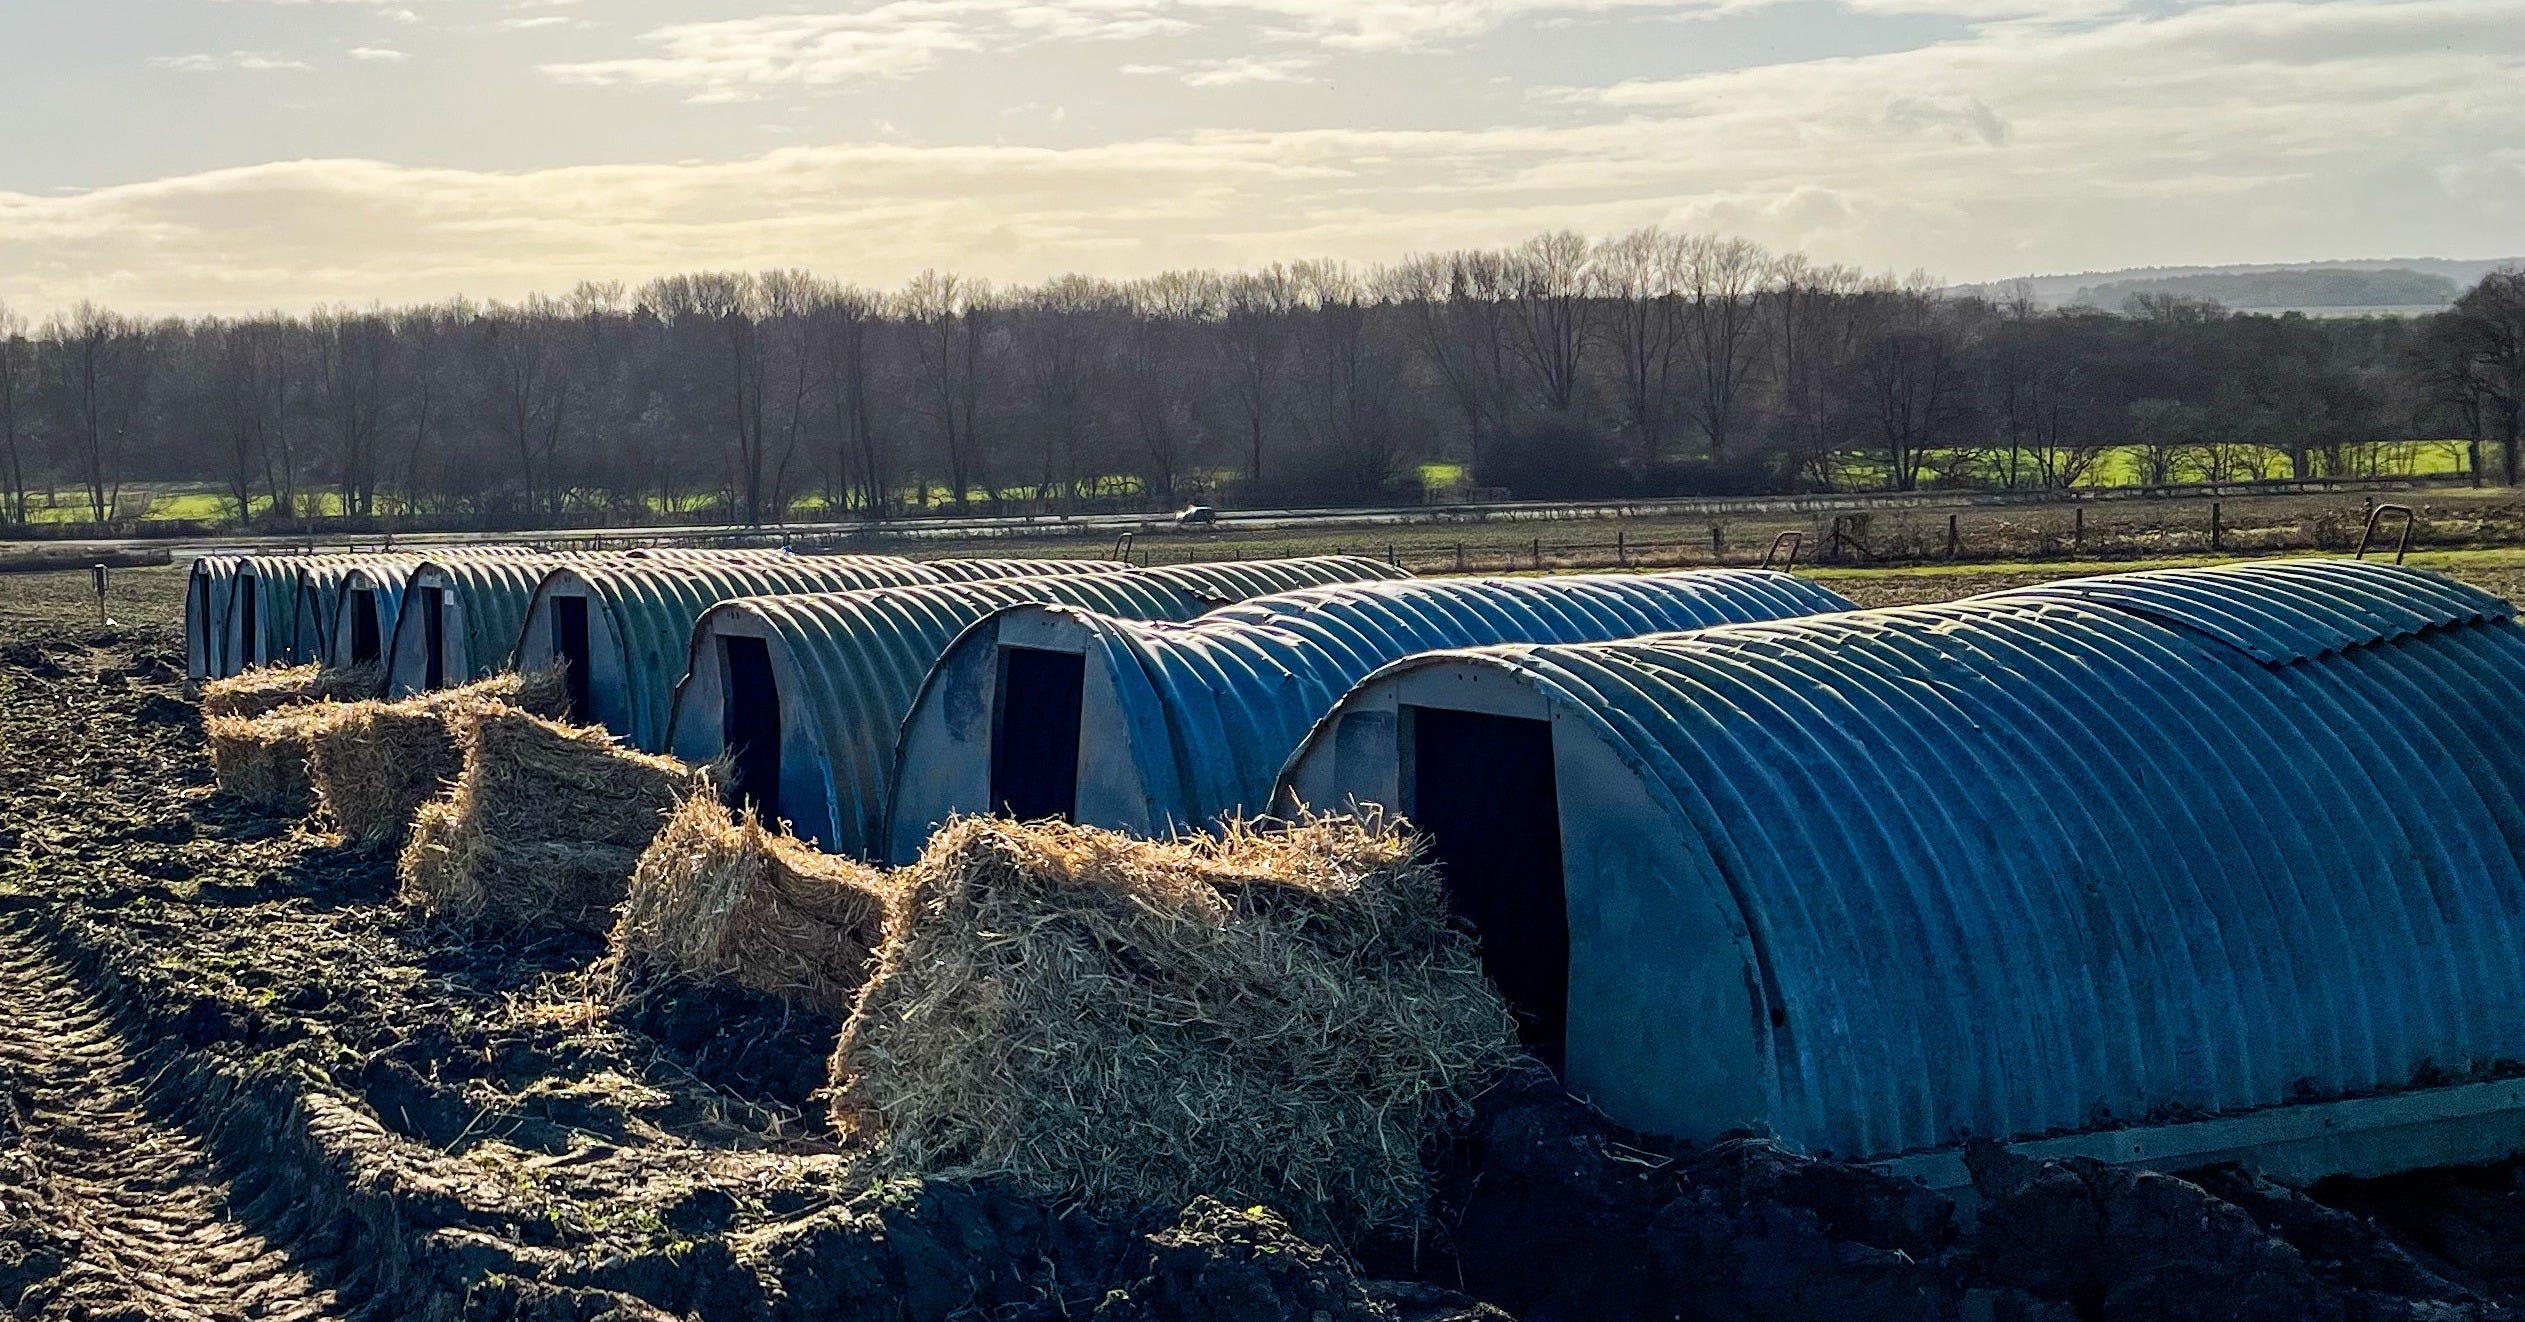
And I have my own pig experience, from small scale all the way up to producing around 500 pigs a year. Pigs are actually very clean animals. We bedded their arks with straw and they would not defecate where they slept. Outdoors, they spread manure across a much bigger area, which means it is less concentrated. Indoors, pigs are enclosed in a space that is either bedded with straw or often on a slatted floor, and that changes the whole manure story. Indoor systems require regular mucking out, then storage, then removal and spreading. Outdoor systems still need active management too, because you have to rotate and rest ground so you do not overload it, especially around feeders and water.
Pigs and poultry are often discussed together because their manures tend to be more nitrogen rich than grazing livestock, and a lot of that comes back to diet and digestion. Chickens and pigs are usually fed energy dense, protein rich rations, often grain and soya based. Protein contains nitrogen, so higher protein diets generally mean more nitrogen ends up in the manure. Cattle and sheep are ruminants, built to turn grass and forage into food through a slower microbial fermentation process in the rumen, which changes how nutrients are processed and can mean the waste is less concentrated in raw nitrogen terms.
Poultry is the extreme case because chickens do not urinate separately. They excrete faeces and uric acid together, which makes poultry manure particularly “hot”, meaning it can release nutrients fast and can drive ammonia losses if it is concentrated and poorly managed. Pig manure can also be relatively high in nitrogen compared with cattle manure, and again the housing, storage, and spreading system matters as much as the animal does.
None of this means ammonia is absent from outdoor or regenerative systems. It means the risk profile is different. When manure is dispersed and in contact with soil, you are working with a living system that can absorb and cycle nutrients. When manure is concentrated, trapped in housing, then removed and stored, you create more obvious points where emissions can build up. Scale matters here as well. The bigger the enclosed operation, the more waste you are handling in one place, and the more important it is to be transparent about what is happening, what mitigation is in place, and what the monitoring shows.
As a rough rule of thumb, fresh poultry manure is often cited as around 1.1 to 1.4 percent nitrogen, pig manure around 0.5 to 0.8 percent, and cattle manure around 0.5 to 0.6 percent, but the real world outcome depends on housing, storage, timing, weather, and how and where it is applied.
What the map is, and what it is not
The public claim, repeated across coverage in The Guardian, The Independent, and The Grocer, is that ammonia pollution hotspots cluster where intensive pig and poultry units cluster.
The mechanism is also clear.
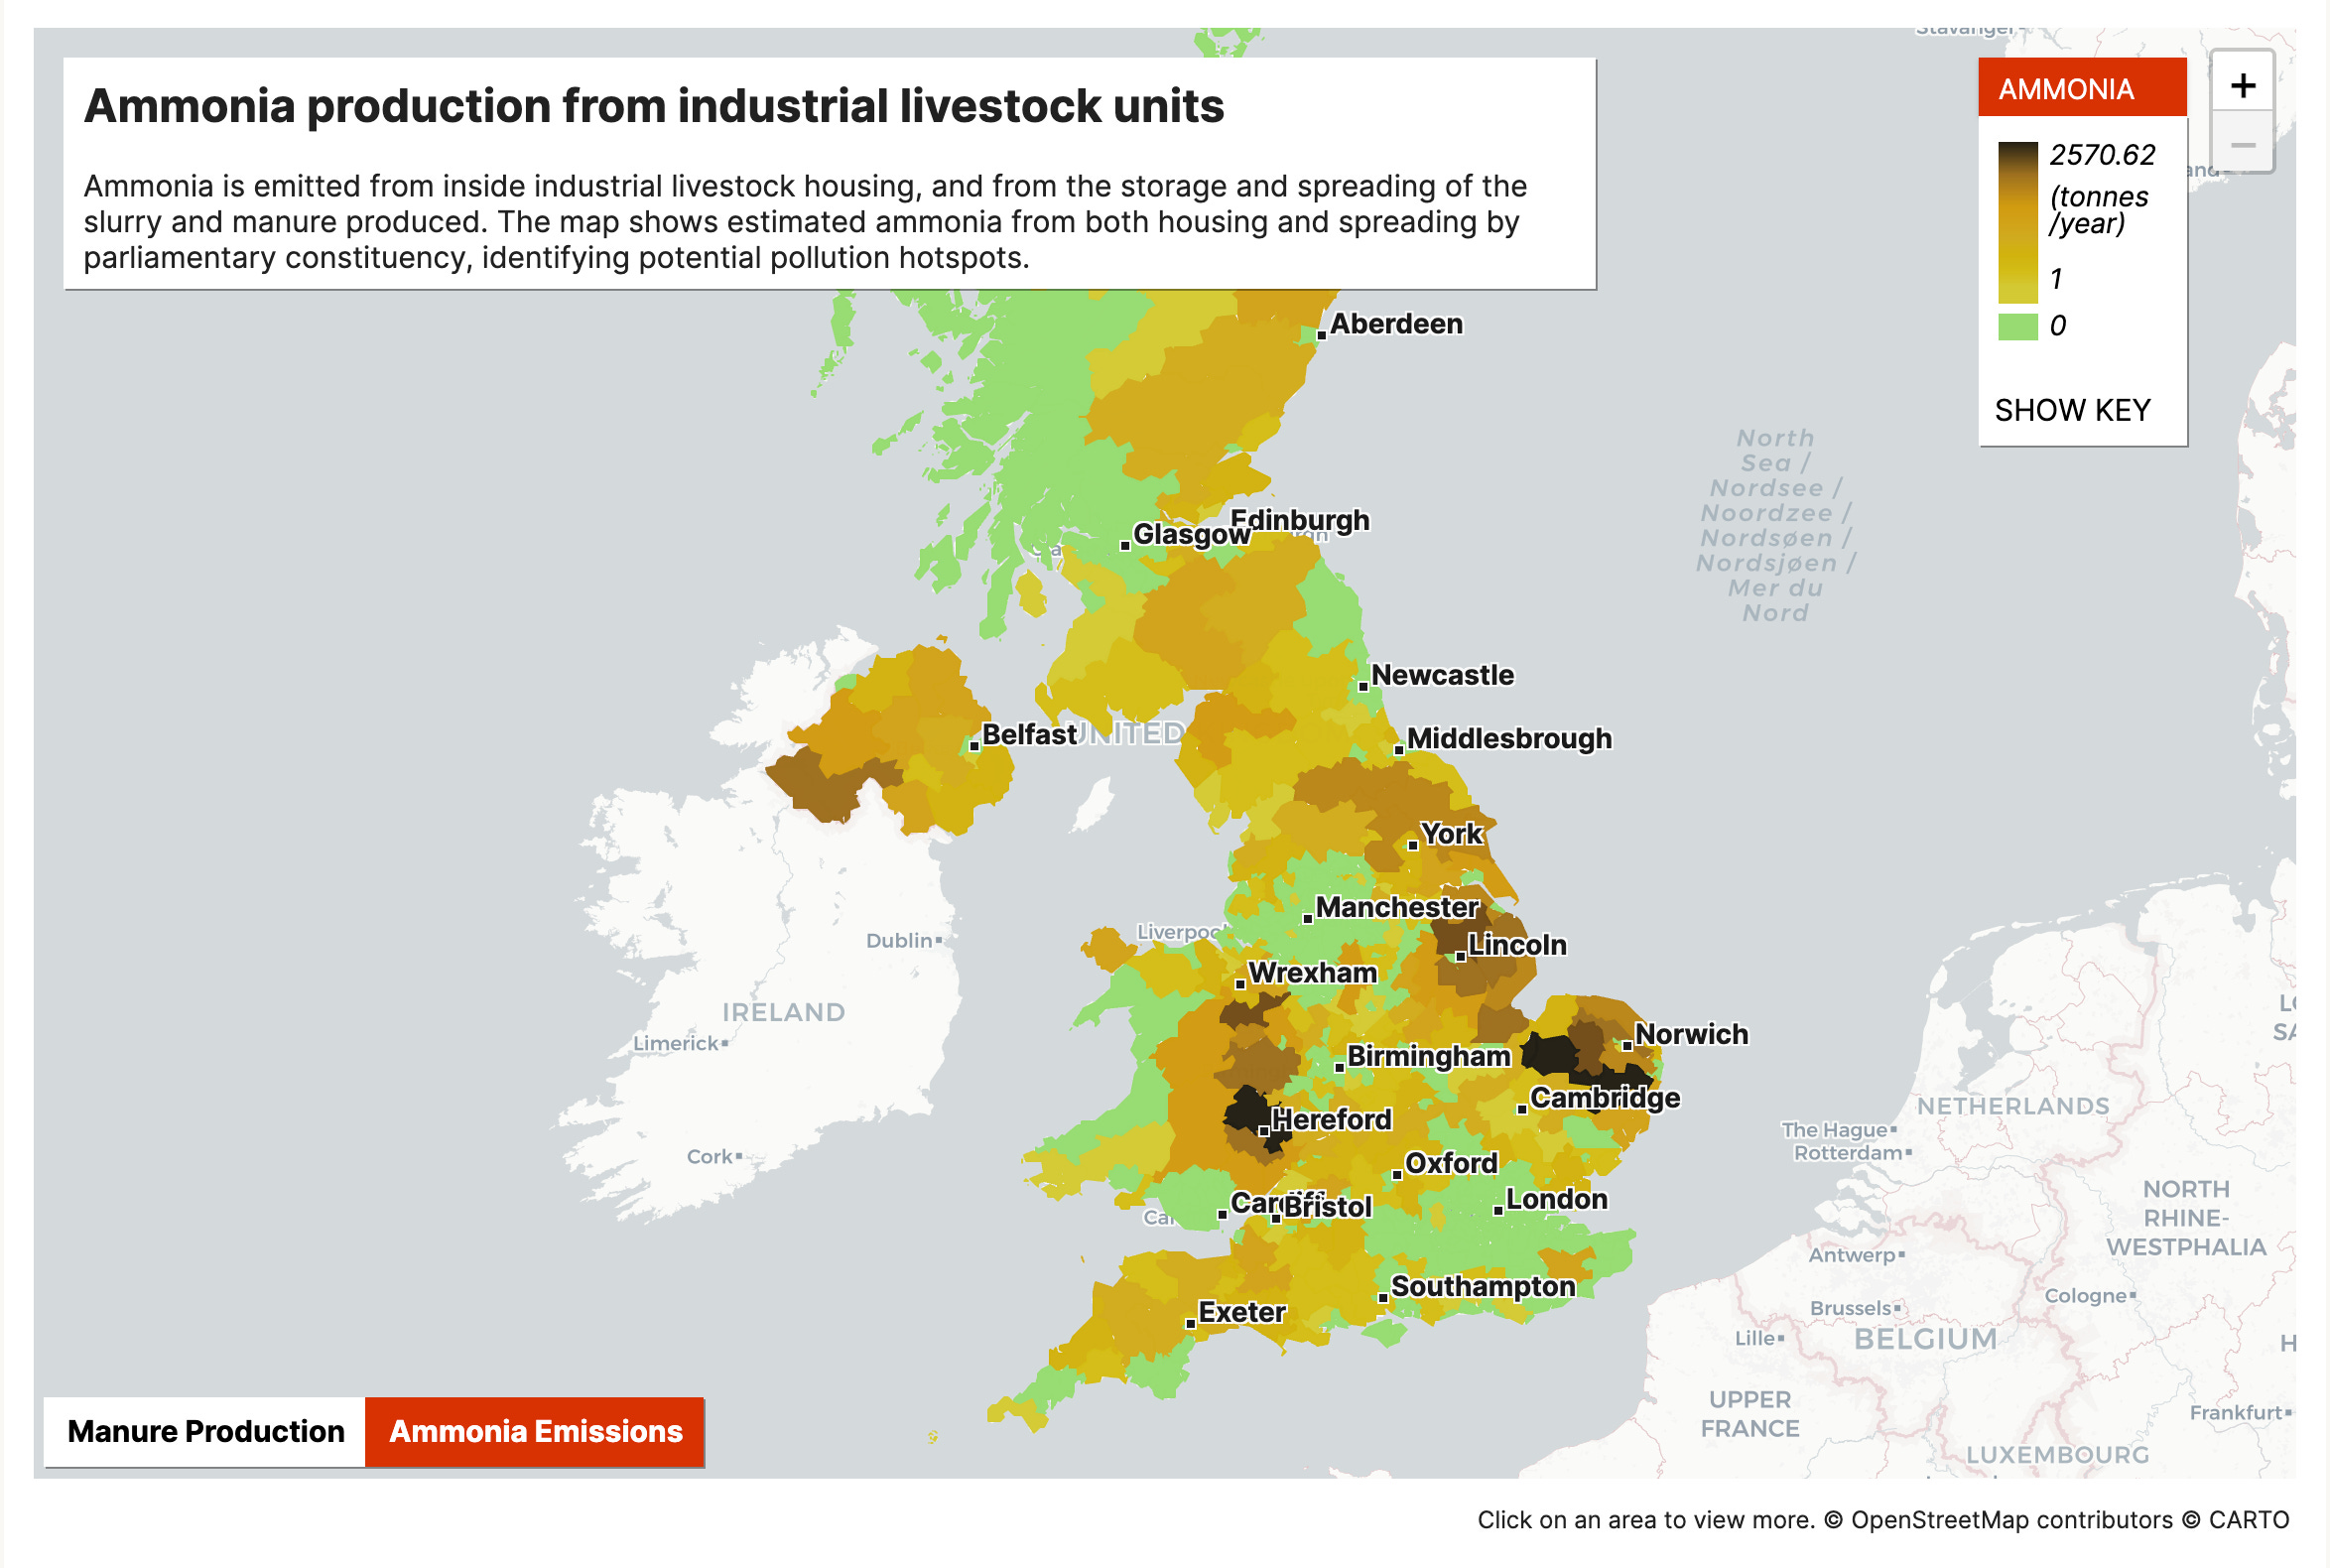
Ammonia released from manure can react in the atmosphere to form fine particulate matter, PM2.5. Long term exposure to PM2.5 is linked to serious health outcomes.
Sustain and CIWF also point to wider ecological impacts from excess nitrogen deposition.
Those are not fringe claims. They are consistent with how ammonia is understood in mainstream air pollution science. The question is not whether ammonia can do harm. The question is what this map can prove, and what it cannot.
The pushback from the pig and poultry sectors
Farmers Weekly reports that pig and poultry organisations have rejected the claims and challenged the map. This is where the argument in the middle matters, because the most important line in that coverage is not the insult, it is the clarification. The map is based on estimates of pig and poultry numbers in each area, and even the report itself is clear it is not designed to show ammonia concentrations in the air or deposition rates.
That is a fair point to make. But it is not the same thing as proving the map is wrong. If you want to argue it is misleading, you have to show what the right inputs should be, and what difference that would make to the picture.
Facts versus claims
This is where I think the public conversation keeps going wrong. Both sides are mixing facts and claims, and then accusing the other side of doing propaganda.
A cleaner way to separate them is to ask what is checkable, and what is interpretation. Facts are things you can point to and verify, like a dataset, a method, a permitted stocking number, an emissions factor, a monitoring station reading, or a regulatory threshold. Claims are the conclusions people build on top of those facts, like this map proves your village is being poisoned, or this map is an attack on farmers, or the sector is heavily regulated therefore the sector is not a problem, or the data is insufficient therefore the conclusion is wrong.
Some of those claims might turn out to be closer to the truth than others. But you do not get there by shouting. You get there by showing your workings.
The pushback, and what would actually settle it
This is the part I want to see more of, less outrage, more evidence.
If the NPA and other bodies believe the map is inaccurate in specific places, the strongest response is not a general statement about regulation. It is location based counter evidence that the public can actually interrogate. That means naming which hotspots are wrong, and showing what measured ammonia concentrations or deposition rates look like in those places, with dates and methods, rather than just insisting the map is unfair.
It also means correcting the inputs in a transparent way. If the map used outdated permitted stocking numbers, publish the corrected numbers. If you think the emissions factors are wrong for UK systems, show why, and what factors should replace them. If mitigation measures in permitted units materially reduce emissions in practice, show the monitoring data that demonstrates that reduction, and be clear about where it is working and where it is not.
If you want to challenge a map, you do not get to do it with vibes. You challenge it with better numbers, better methods, or better ground truthing. Otherwise you are not disputing the pollution, you are disputing the discomfort of being associated with it.
This is not a culture war
This is where I think the conventional versus regenerative framing can become a trap, because ammonia is not a branding problem. It is a nitrogen management problem, and it shows up wherever large volumes of manure are produced, stored, and spread.
That can happen in systems that call themselves conventional. It can also happen in systems that call themselves regenerative or organic. The argument we need is not about which label wins. It is about what happens at landscape scale when livestock numbers concentrate, when infrastructure is missing, when enforcement is patchy, and when the public is asked to trust a system they cannot see.
The argument in the middle
Two things can be true at once. The map can be based on real data and a transparent methodology, and still be too blunt to use as a local health verdict. The pig sector can be heavily regulated, and still contribute to ammonia in ways that matter to neighbours, ecosystems, and public health.
If we want to get out of the trench warfare, we need a higher standard from everyone. Campaigners should be clear about what their map does and does not prove. Industry bodies should stop hiding behind the word regulated and start publishing the evidence that regulation is delivering the outcomes they claim. And government should stop pretending this is a culture war, because it is an infrastructure and enforcement question, and it is also a food system question.
If we keep building systems that concentrate animals, concentrate waste, and then concentrate the risk in a handful of rural places, we should not be surprised when the public starts asking what they are breathing.
If this helped you make sense of the ammonia map debate, please subscribe. Free subscribers keep the conversation going, and paid subscribers fund the time it takes to do this properly. And if you know someone who is stuck in the slogans on either side, please share this with them.
Sources
New map exposes ammonia pollution hotspots from factory farms - Sustain
Mapped: Ammonia production from industrial livestock - Sustain
Ammonia air pollution hot spots found in parts of UK with most factory farms - The Independent
Pig and poultry sectors reject new claims about ammonia levels - Farmers Weekly
'Serious Concerns" raised about factory farming as ammonia hotspots revealed - The Grocer
Ammonia pollution hotspots found in areas of UK with most pig and poultry factory farms - The Guardian
I love, that shared knowledge 😁, here we send greetings from Uganda in East Africa we are Young Environmental conservation Initiative a community based organization 🙏
Another insightful read! We could achieve so much, in every country around the world, by raising the level of discourse to disputing information rather than typifying those who challenge us. Unfortunately, educating the public is never the priority in debates like these. It would add so much value…